Last updated: June 26, 2020
On your dashboard, you can drill into the metrics displayed in a report for more specific information on the records behind the data.
- In your HubSpot account, navigate to Reports > Dashboards.
- To view another dashboard, click the dashboard name in the upper left, then select another dashboard in the dropdown menu.
- Locate the report that you want to drill into.
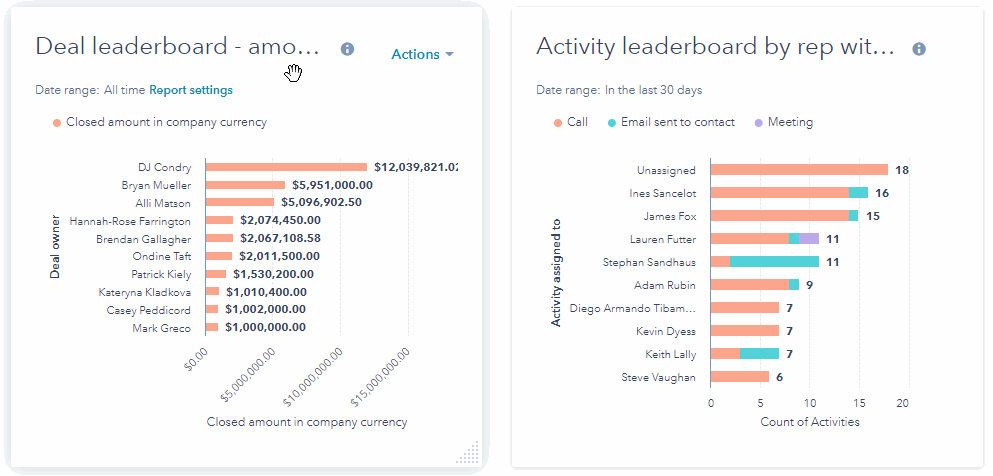
- Click a data point on the report to drill into that specific metric. A dialog box will open to show you details of the records that contribute to that specific metric. To review specific information about an individual record, click the record name.
- In the dialog box, click Group data and select a property to group the data by. For example, when looking at a specifc user's closed revenue, you can group the data into pipelines to see the pipeline he's most successful at. This makes some data more actionable.