Last updated: June 26, 2020
Please note: to see overall website or blog performance, navigate to your dashboard marketing reports. Marketing Hub Professional and Enterprise users can create custom website and blog reports in the website analytics tool.
Analyze page or blog post performance
- In your HubSpot account, navigate to your blog, landing pages, or website pages.
- Click the name of the page or post you want to analyze.
-
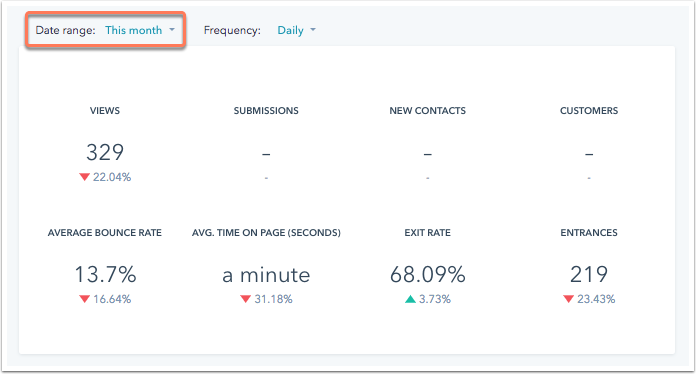
In the Performance tab, you'll see detailed metrics about each page or post. To analyze data over a specific period of time, click the Date range
dropdown menu at the top.-
Views: the number of times this page or post was loaded on a web browser.
-
Submissions: the number of form submissions on this page or post.
-
New Contacts: the number of new contacts created from this page or post.
-
Customers: the number of customers who originally converted on this page or post that are currently in the lifecycle stage of
customer . -
Average Bounce Rate: the percentage of sessions that started on this page or post and did not move to another page on your site.
-
Average Time On Page: the total amount of time visitors spent viewing this page or post, divided by the total number of views. This calculation excludes exits.
-
Exit Rate: the percentage of sessions that ended after viewing this page or post.
-
Entrances: the number of sessions where this was the first page or post viewed.
-
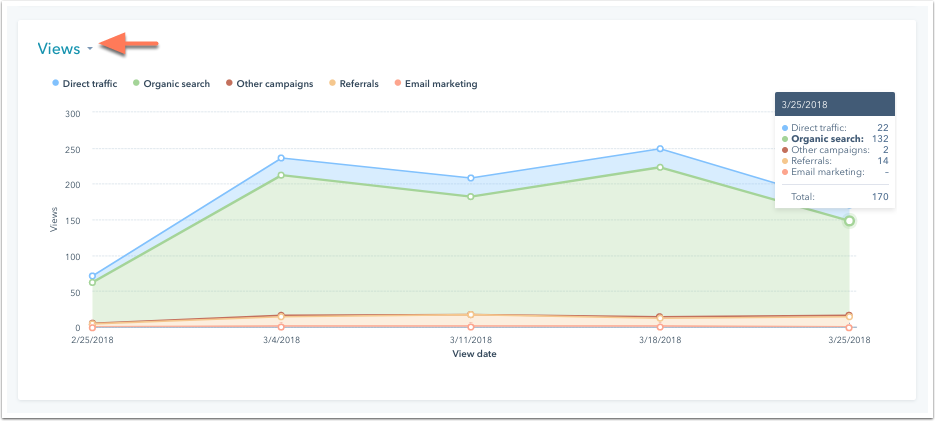
Data visualization chart
Below the top level metrics is a data visualization chart that plots one metric over time by source. Each source is labeled at the top of the graph with a corresponding color bubble. In the chart, each source type indicates how a visitor started their session on your site or blog.
- To see a different metric in the data visualization chart, click the dropdown menu in the upper left and select another metric.
- Hover your mouse over a specific point on this graph to view a breakdown of the statistics.
- To adjust the timeframe for your report, click the Frequency dropdown menu at the top of the Performance tab to select whether data is plotted on a daily, weekly, or monthly basis.
Sources data
Below the data visualization chart is a table showing performance metrics from your content broken down by source. Select or clear the source checkbox to edit the sources included in the chart. Click any source listed in the table to drill down into specific sources data.

- Click Edit columns.
- In the Columns section, select the checkboxes next to the metrics you want to include. Up to seven metrics can be selected at a time.
- To remove a metric from the Selected Columns section, click the X.
- To reorder your metrics, click and drag a selected metric into the order you want in your report.
-
Click Save.

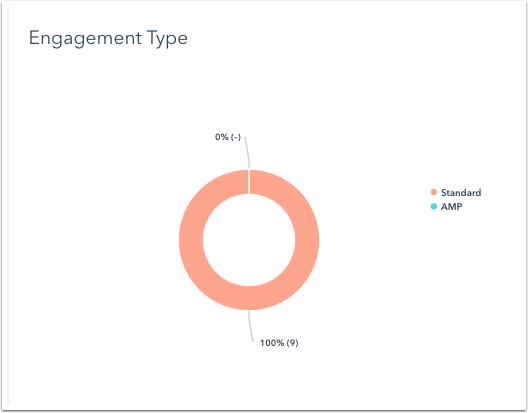
Engagement type (blog posts only)
For blog posts, you'll see a breakdown of engagement by device type based. This is based on whether the AMP or standard version of your blog was viewed.
Video analytics
If you've enabled the Vidyard integration and added videos to your content, you'll see two reports with your video metrics Video views and Video retention.
Please note: to see traffic sources and video reports for your A/B test pages, you must drill down into a specific variation using the Variation dropdown menu at the top or choose a winning variation. Traffic source and video data cannot be combined for multiple variations.
Smart content (pages only)
To analyze the performance of smart content:
- Click the Smart content tab to see a breakdown of how the page's smart content performed compared to default content.
- To adjust the timeframe for your report, click the Frequency dropdown menu at the top of the Performance tab to select whether data is plotted on a daily, weekly, or monthly basis.
- To see a different metric in the data visualization chart, click the dropdown menu in the upper left and select another metric.
 Below the chart is a breakdown of how visitors engaged with your content based on whether or not a smart content rule was applied. This breakdown does not include sources data.

Search engine optimization (SEO)
In the Optimization tab, you'll find recommendations to recommendations to improve your content's performance in search engine results. If you've enabled the Google Search Console integration, you can see even more data from Google about how your page is performing for specific search terms.
If you don't see data populating in the Optimization tab, learn about issues that can prevent HubSpot's tools from crawling your site.
Optimize a page or blog post for search engines
You can optimize and individual page or blog post for search engines within the content editor. Recommendations will update in real time based on edits made to your page. You can also review detailed SEO performance data. Learn more about SEO best practices.
-
In your HubSpot account, navigate to your blog, landing pages, or website pages.
- Hover over an existing page or post in your dashboard, then and click the Actions dropdown menu and select Edit.
-
On the left sidebar panel, click the bar graph icon to open the Optimize tool. You'll see recommendations categorized into groups, based on where you need to address them in your content.